Loading variables from a file to a bash script

Elegant

I’m just copying the idea from this answer in StackExchange because it looks to me as an elegant way to solve this question.

I have a file like this:
# Kernel
loggerlevel=0
fromlogfile=1
variables=100
period=60

Filled with variables and their values.

Next the script to process and use those variables:

#!/bin/bash

source kernel

echo $loggerlevel
echo $fromlogfile
echo $variables
echo $period

After sourcing it, we get :

. process.sh 

0
1
100
60

Easy, peasy!

Make your program Always run as Administrator

For this trick we are using a Registry Hack.

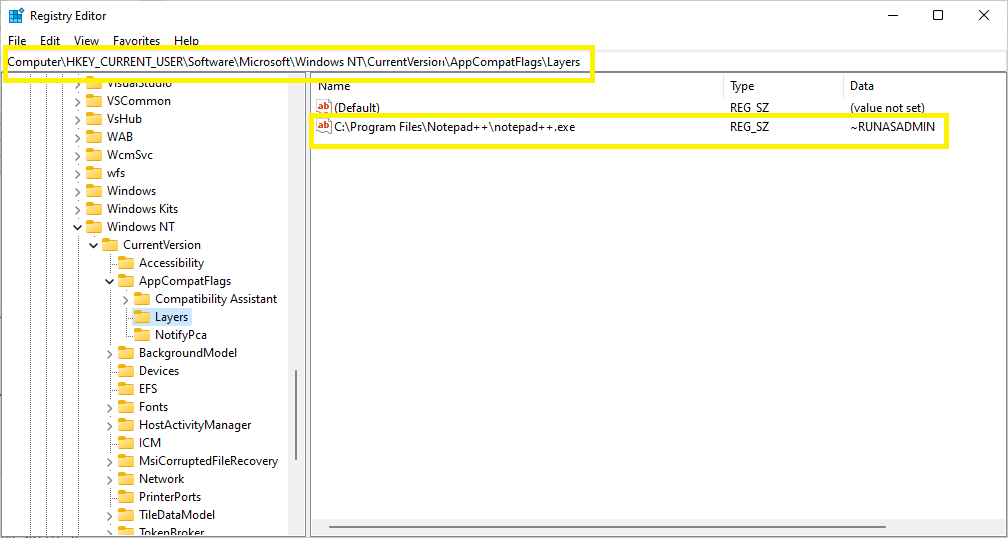
Go to the key:

HKEY_CURRENT_USER\Software\Microsoft\Windows NT\CurrentVersion\AppCompatFlags\Layers

Add as new “String” value the whole path of the application you want to always open as administrator.

Double click in the new created value and for the value set: ~RUNASADMIN.

Close the registry and try now double-clicking on the executable or the shortcut if created.

SQL Server – attach database – Access is denied error

Setup

I found this error while I was following the process to change the edition of a database server from Enterprise to Developer Edition.

The process I was following is described in SQL SERVER – How to Downgrade SQL Server Edition?

Although it is not the exact situation as described there but it was really helpful.

So summarizing and for your convenience here you have the steps I followed:

  • Make sure you are not using any feature which is not there in destination edition. This can be done by using catalog view dm_db_persisted_sku_fearures. This should be run on each database to find features.
  • Backup ALL the databases before uninstall.
  • Make a note of select @@version, sp_configure
  • Uninstall the SQL server enterprise edition and install the developer edition. While installing the new edition I changed the instance name.
  • Ran select @@version, sp_configure and got a small difference. CLR was not enabled so I ran the next script to enable it.
sp_configure 'show advanced options',1
GO
RECONFIGURE
GO
sp_configure 'clr enabled',1
GO
RECONFIGURE
GO
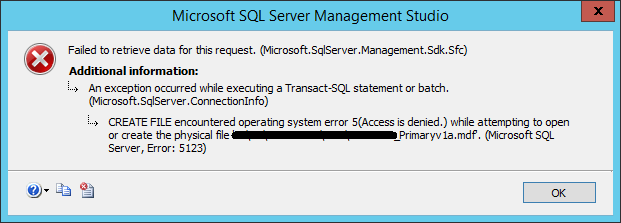
  • The next step is to attach the already existing databases and here is where the problems come:


Confrontation

I was suspecting that the previous SQL Server installation was owning these files so next logical step is to take ownership of those files and have full access to them.

To make this task easier I used the command line as administrator.

To take ownership

takeown /F *.*

And to give me full access to those files

icacls * /grant:r DOMAIN\myuser:F


Conclusion

After run the above commands I went to SQL Server Management Studio and using the menu I could attach all the databases successfully.


Windbg – Iterating through multiple objects

To make your life easier, instead of manually dump every object returned by !dumpheap you can automatize it.

To do that let’s use the token “.foreach” in windbg:

@@.foreach (token {!dumpheap -mt 0f43ad08 -short} ) {!do “token”;!objsize “token”;!gcgen “token”}@@

other possible form of this command although I wouldn’t use it for this case. I write it here as an illustration

@@.foreach /pS 4 /ps 3 (token {!dumpheap -mt 07ab0584} ) {!objsize “token”;!gcgen “token”}@@

Happy debugging!!

Creating a static library using VS Tools (command line)

This is a super short tutorial how to build and use a static library using Visual Studio tools (a.k.a. command line)

Using your favorite tool editor, in my case vim, create two files with the next content:

teststaticlib.cpp
///
extern “C” int Test
{
return 123;
}

///

teststaticapp.cpp

///

#include <iostream>

extern “C” int Test();

int main()
{
std::cout << Test() << std::endl;
}

///

To build follow the next steps:

///
1) cl -c teststaticlib.cpp
///
( -c stands for “compiles without linking”)
///
2) lib teststaticlib.obj
///

And the final step is
///
3) cl teststaticapp.cpp teststaticlib.lib
///

Now you can try the exe file just generated.

Enjoy!

NOTE: To check an example using Visual Studio 2012 you may follow this link:
Static linking with Visual Studio

Disabling UAC in Windows 7 and Windows 2012

Disabling UAC (User Access Control) or in other words…Run all programs as Administrator by default

That’s easy :)..

Open Windows Registry and go to the next key:

HKEY_LOCAL_MACHINE\SOFTWARE\Microsoft\Windows\CurrentVersion\policies\system

There edit the value “EnableLUA” and set it to 0.

Then you have to reboot your windows to make it works.

Enjoy!

How to survive obscure random hangs and crashes?

A client was having random hangs and crashes in one of our applications. How to troubleshoot this kind of issues? You can see next a possible approach.

Due to the nature of these issues and the fact that the user wasn’t giving too much information about the circumstances surrounding the cases we didn’t have a clue about their origin, and of course we also were not able to apply our developer tools to investigate. The customized application log was not giving useful information either.
The only information we were getting is “…the application freezes and then we have to go to Task Manager and kill the application and start over…”

So, let’s start with getting better information. I prepared a small batch script to install and setup a noninvasive tool and to create a shortcut in their desktop and/or toolbar.
From now on, every time the user was detecting a freeze we asked them to click on the button we had installed to collect better information. In that way the tool created a screenshot, created a memory dump, and finally it killed the application.
The first time we saw the screenshot and confirmed with the memory dump we learned that there was a crash in the application not a hang.

Now with this information and using a “.reg” file to create specifics windows registry key and values, [WER settings|https://msdn.microsoft.com/en-us/library/windows/desktop/bb513638%28v=vs.85%29.aspx||WER Settings] , we configured the workstation to create memory dumps every time the application crashes.
Ok, now we have a couple of memory dump files and learned from them that we’re having the feared heap corruptions. Sometimes when the application was closing or other times when the garbage collector was trying to release some memory we noted the heap corruptions were occurring.
Using “gflags” first and later “application verifier” from Microsoft we tried to reproduce in house and could detect where the heap corruption was happening.

Fine, we have now pinpointed the source code involved in this heap corruption so let’s start in on how to fix it.
Well, this part was not easy either. It was happening in a transition between C++ native and C++ managed code (C++/CLI).
It was happening in a shared class between these two worlds. The transition between these two worlds were not considering the byte alignment of the different primitive types specifically in this case the “bool” type.

Although there are several ways to solve this situation I chose the easiest way, replacing the “bool” type with a “int” type in the class declaration.
Rebuilt the module and Voila! The client has not had any more random freezes/crashes since then.

Happy debugging!
Windbg – Getting environment information from the target machine

This is a brief explanation about how to get information from the target machine with some examples.

Let’s suppose you already have opened the memory dump in your windbg. Let’s also suppose that you already setup the symbols path properly.
Ok, then.

If you want to find out the name of the target’s machine execute:
!envvar COMPUTERNAME

In case you want to know the user logged in the machine :
!envvar USERNAME

Now, you want to know the architecture of the current process:
!envvar PROCESSOR_ARCHITECTURE

and more…

Here you have for example a list of Standard Environment Variables you can experiment on:

http://ss64.com/nt/syntax-variables.html

==============================================

Enjoy debugging!

Debugging .NET optimized code

How to see the full content of the variables in Visual Studio if the binary is optimized or not built with full support for symbols.

Let’s suppose that we already have the symbols or pdb file of our dll when debugging under Visual Studio and you cannot check or examine some of the variable values.

The reason behind this issue is most probably that the dll is optimized or maybe it wasn’t built with full symbols and this means the debugger only has full access to some of the variables.

If you don’t want to re-compile for any reason you can use the next trick.

If the dll is MyFantasticDll.dll then you have to create another empty file named as MyFantasticDll.ini.

Open, fill and save it with

[.NET Framework Debugging Control]
GenerateTrackingInfo=1
AllowOptimize=0


This would cause the JIT-compiler to not optimize the resulting machine code and the next time you want to see the values you will see them in Visual Studio.

So to make it work we need the three files:

                           MyFantasticDll.dll
                           MyFantasticDll.pdb (the symbols file necessary to debug)
                           MyFantasticDll.ini


and all of them need to be together in the same folder.

Take into account that the original dll could be placed in some folder under the GAC or a Temporary Folder.

To find out the exact location you may want to use the “Modules” tab in Visual Studio and check the “Path” column.

Here you have the source:

https://msdn.microsoft.com/en-us/library/9dd8z24x%28v=vs.110%29.aspx

======================================================

Enjoy debugging!